
Solana price action has continued to compress after months of sideways movement, keeping traders focused on a potential breakout.
The market shows signs of building pressure as prices hold within a narrow range. Analysts point to tightening structure as a precursor to a decisive move.
Attention now shifts to whether resistance breaks and unlocks higher targets.
Solana technical structure signals breakout potential
Solana price is trading near the $85 region after declining from November and January highs. Price remains confined within a tight band, with support holding between $80 and $85.
Sellers continue to reject moves toward the upper range, reinforcing a clear resistance ceiling.
Chart analysts WebTrend and Ray both identify $100 as a near-term target if resistance breaks.
WebTrend reported two rounded bottom formations, one in February and another in early April. He noted these patterns reflect weakening selling pressure at similar levels.
Meanwhile, Ray described a triangle compression pattern forming between $70 and $97. He explained that descending highs and rising lows indicate tightening volatility.
Ray stated that a breakout above the $85–$90 trendline could trigger upward momentum. He expects the price to first test $97, then challenge the $100 psychological level.
If momentum holds, he added that $125 becomes the next upside objective.
Indicators reflect ongoing consolidation phase
Daan Crypto Trades highlighted the prolonged consolidation phase. He observed that SOL has traded within a 10% range for nearly three months.
According to him, such compression often leads to strong moves of 20–30%. He emphasized that the direction depends on which boundary breaks first.
Momentum indicators support the consolidation outlook. The Relative Strength Index stands near 53, showing balanced conditions.
The daily MACD displays limited divergence, offering no clear directional bias. However, the 200-period EMA sits near $112, well above the current price. This gap signals lingering long-term bearish pressure.
Derivatives data from CoinGlass shows declining activity but rising positioning. Trading volume dropped 37.88% over the past 24 hours.
In contrast, open interest increased by 3.87%. This trend suggests traders continue building positions despite lower activity.
Total liquidations reached $2.23 million, with $1.84 million from short positions.
On-chain data from Santiment reveals shifting network activity and sentiment
On-chain data from Santiment reveals weakening network participation. Weekly active wallets declined from 5.01 million in February to 2.89 million.
The firm reported fewer addresses currently transferring SOL, pointing to reduced user engagement.
However, social sentiment has strengthened despite the drop in activity. Santiment noted that positive mentions now dominate discussions across platforms.
Data shows roughly 3.2 bullish comments for every negative one on X, Reddit, and Telegram.
Key resistance remains between $90 and $92, while support holds near $80. A break below $80 could push the price toward the $70–$75 zone.
Meanwhile, a confirmed breakout above resistance could validate the move toward $100.
Solana price market outlook
On the 1-day chart, Solana shows a sideways consolidation with a slight bullish bias. Price action forms small higher lows, signaling gradual upward pressure.
The MACD sits near the zero line with a mild bullish crossover. This indicates early momentum recovery, though strength remains limited.
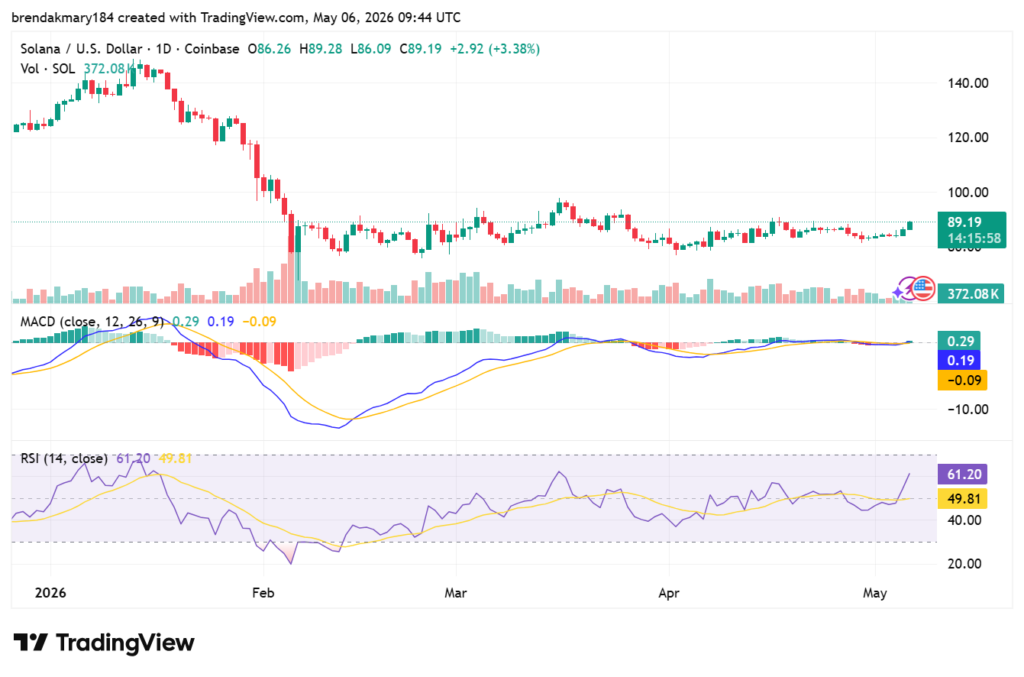
The RSI is in the low 60s, reflecting moderate bullish momentum. It is not overbought, suggesting room for further upside.